学习R包seurat对scRNA-seq数据进行分析
scRNA-seq数据分析(三)
😊seurat不是一个R包,seurat是一个优秀的R包
😊seurat不是提供服务的,seurat是提供一条龙服务的
- seurat版本有2.×.×和3.×.×。同一般的R包升级不太一样的是:2.×和3.×之间区别还是蛮多的,各种函数也都有变化,虽然升级带来了更多的优点,但是函数名称的变化就会给学习者带来不小的麻烦呀!
- 这里先学习2.×。为什么呢?因为我还不会3.×呀😵😏😜
载入R包
1
2
3
| rm(list = ls())
options(warn=-1)
library(Seurat)
|
同样使用scRNAseq内置数据集
1
2
3
4
5
6
| library(scRNAseq)
data(fluidigm)
assay(fluidigm)<-assays(fluidigm)$rsem_counts
ct<-floor(assays(fluidigm)$rsem_counts)
ct[1:4,1:4]
counts<-ct
|
创建Seurat要求的对象
1
2
3
| names(metadata(fluidigm))
meta<-as.data.frame(colData(fluidigm))
identical(rownames(meta),colnames(counts))
|

1
2
3
4
5
6
| seu<-CreateSeuratObject(raw.data = counts,
meta.data = meta,
min.cells = 3,
min.genes = 200,
project = "seu")
seu
|

增加相关属性信息
1
2
3
4
5
|
mito.gene<-grep(pattern = "^MT-",x=rownames(x=seu@data),value = TRUE)
percent.mito<-Matrix::colSums(seu@raw.data[mito.gene,])/Matrix::colSums(seu@raw.data)
seu<-AddMetaData(object = seu,metadata = percent.mito,col.name = "percent.mito")
|

可视化(初步)
1
2
|
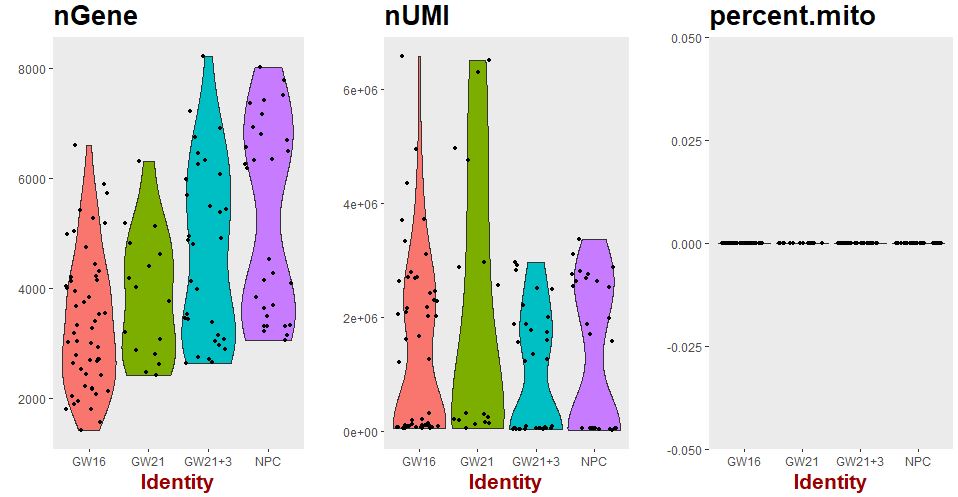
VlnPlot(object = seu,features.plot = c("nGene","nUMI","percent.mito"),group.by = 'Biological_Condition',nCol = 3)
|
1
2
|
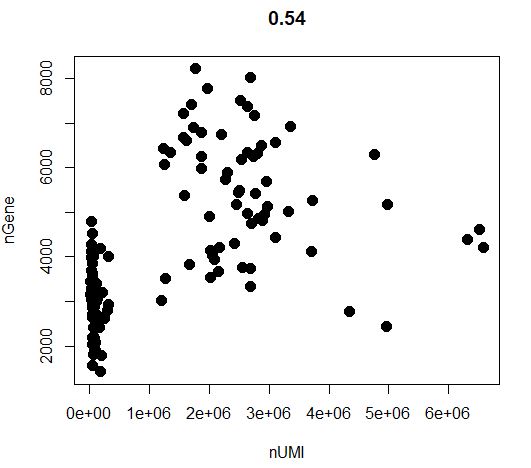
GenePlot(object=seu,gene1="nUMI",gene2="nGene")
|
1
2
3
|
tail(sort(Matrix::rowSums(seu@raw.data)))
GenePlot(object = seu,gene1 = "SOX11",gene2 = "EEF1A1")
|


1
2
|
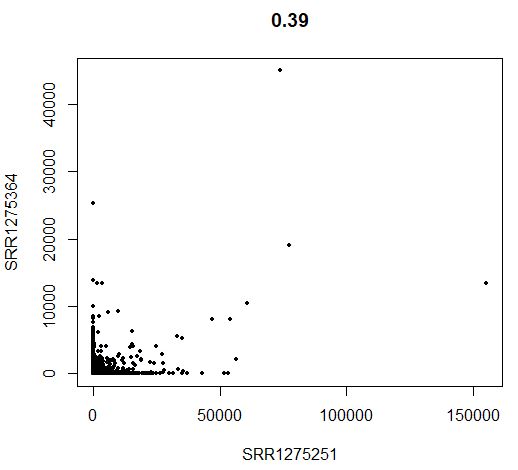
CellPlot(seu,seu@cell.names[3],seu@cell.names[5],do.identify=FALSE)
|
表达矩阵归一化
只有进行归一化后,样本之间的比较才更能说明问题
1
2
3
4
5
6
| identical(seu@raw.data,seu@data)
seu<-NormalizeData(object = seu,normalization.method = "LogNormalize",
scale.factor = 10000,display.progress = F)
identical(seu@raw.data,seu@data)
|

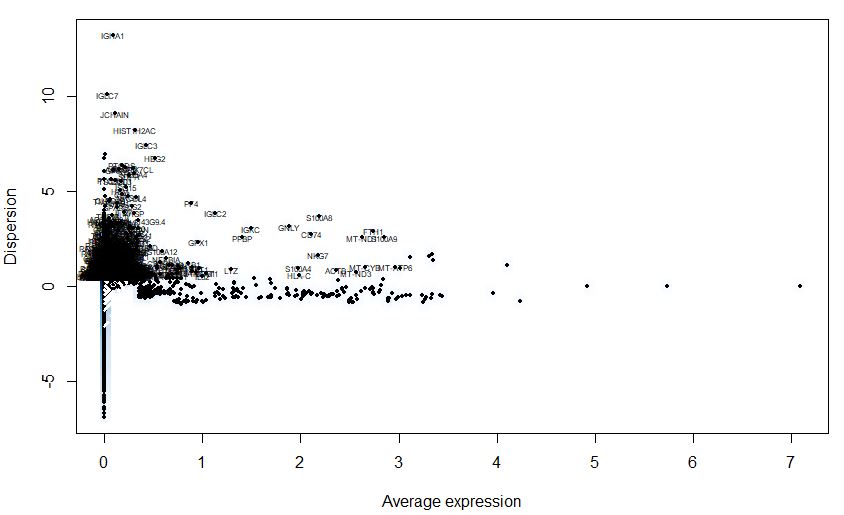
寻找波动比较明显的基因,后续使用这些差异基因进行分析,主要为了降低计算量
1
2
3
4
5
6
| seu<-FindVariableGenes(object = seu,mean.function = ExpMean,dispersion.function = LogVMR,
x.low.cutoff = 0.0125,
y.high.cutoff = 3,
y.cutoff = 0.5)
length(seu@var.genes)
|

对归一化后的矩阵进行分群
- 对矩阵进行回归建模,以及scale
- center=T:每个细胞中基因表达量-该基因在所有细胞中的表达量
- scale=T:每个细胞中基因中心化后的表达值/该基因所在所有细胞中表达值的标准差
- 注意:执行ScaleData之前需要先执行NormalizeData
1
| seu<-ScaleData(object = seu,vars.to.regress = c("nUMI"),display.progress = F)
|
PCA降维
1
2
3
4
5
6
7
|
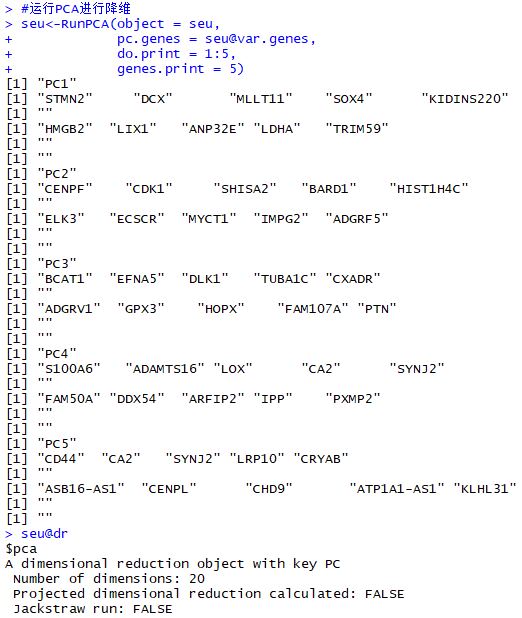
seu<-RunPCA(object = seu,
pc.genes = seu@var.genes,
do.print = 1:5,
genes.print = 5)
seu@dr
|
1
| tmp<-seu@dr$pca@gene.loadings
|

1
2
|
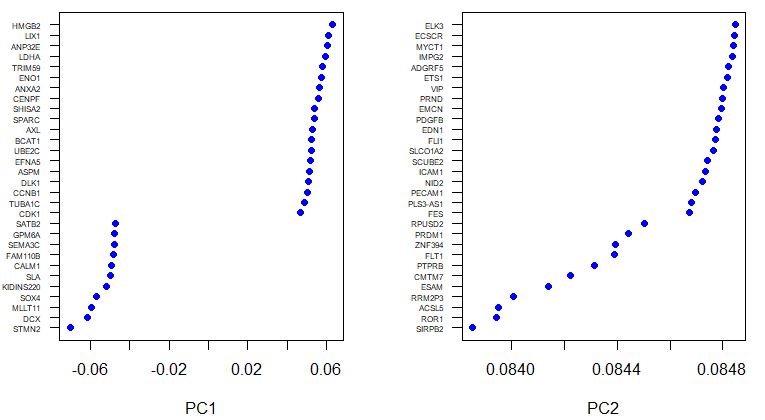
VizPCA(seu,pcs.use = 1:2)
|
1
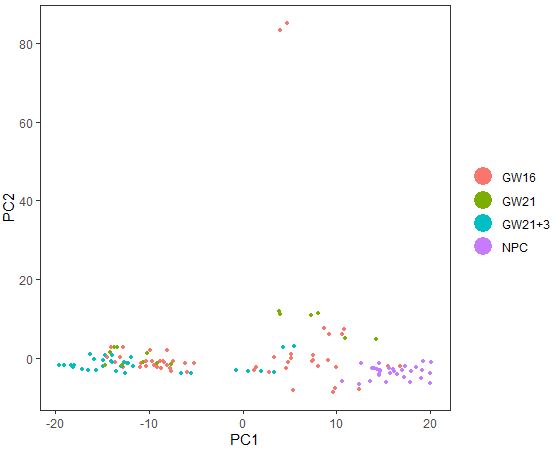
| PCAPlot(seu,dim.1=1,dim.2=2,group.by='Biological_Condition')
|
1
2
3
4
5
|
PCHeatmap(object = seu,pc.use = 1,cells.use = ncol(seu@data),do.balanced = TRUE,label.columns = FALSE)
|
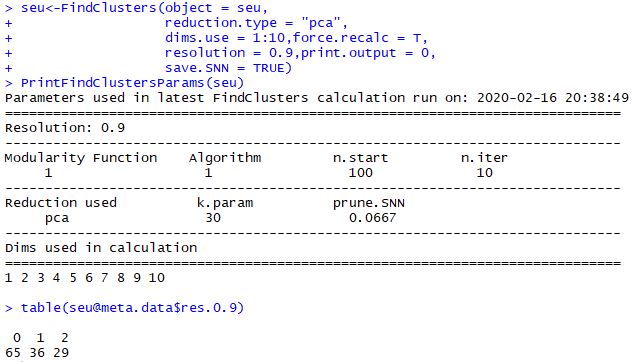
基于PCA情况看看细胞如何分群
重点:需要搞清楚resolution参数
1
2
3
4
5
6
7
| seu<-FindClusters(object = seu,
reduction.type = "pca",
dims.use = 1:10,force.recalc = T,
resolution = 0.9,print.output = 0,
save.SNN = TRUE)
PrintFindClustersParams(seu)
table(seu@meta.data$res.0.9)
|
resolution的值调得不一样,最后table出来得细胞亚群数也会不一样
细胞分群后的tSNE图
1
2
3
4
5
| seu<-RunTSNE(object = seu,
dims.use = 1:10,
do.fast=TRUE,
perplexity=10)
TSNEPlot(object = seu)
|
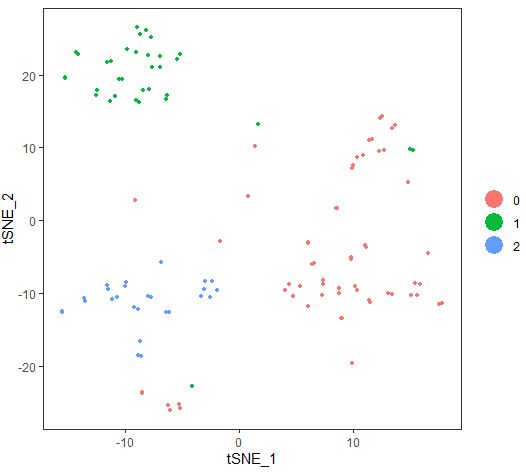
同样是PCA降维算法得到得3各细胞亚群,tSNE明显展示出更好的试图效果
1
2
3
4
5
6
7
| table(meta$Biological_Condition)
table(meta$Biological_Condition,seu@meta.data$res.0.9)
|
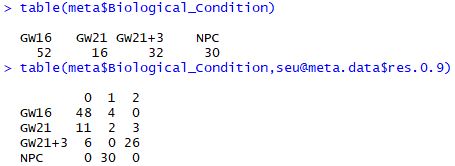
对每个亚群寻找marker基因
下面的代码需要适时修改,因为每次分组都不一样,本次是3组,因为pca降维成3组
以第一群细胞为例ident.1 = 1
1
2
3
4
5
6
7
8
| markers_df<-FindMarkers(object = seu,ident.1 = 1,min.pct = 0.25)
print(x=head(markers_df))
markers_genes=rownames(head(x=markers_df,n=5))
vlnPlot(object=seu,features.plot=markers_genes,use.raw=TRUE,y.log=TRUE)
FeaturePlot(object = seu,
features.plot = markers_genes,
cols.use = c("grey","blue"),
reduction.use = "tsne")
|

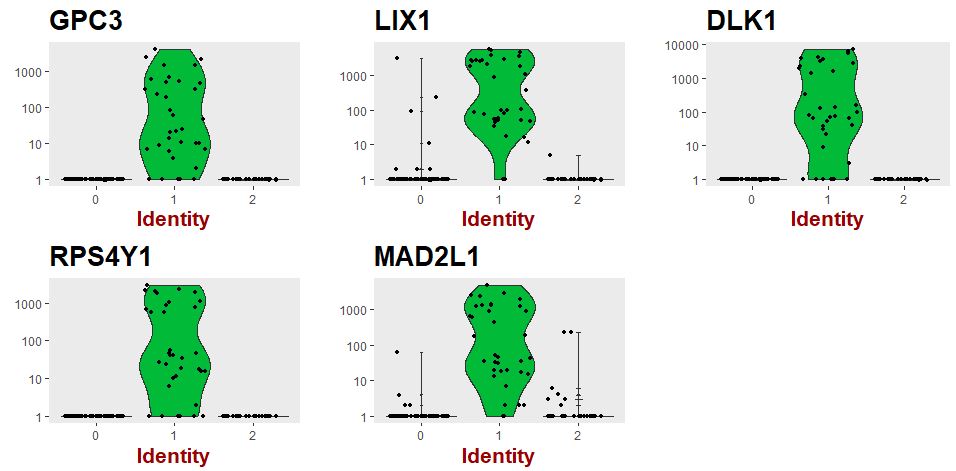
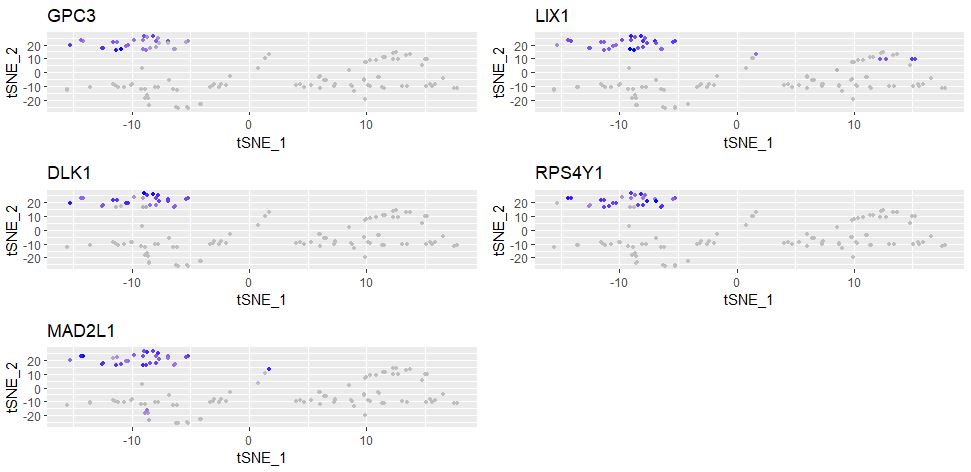
展示各个分类的marker基因的表达情况
1
2
| seu.markers<-FindAllMarkers(object = seu,only.pos = TRUE,min.pct = 0.25,thresh.use=0.25)
DT::datatable(seu.markers)
|
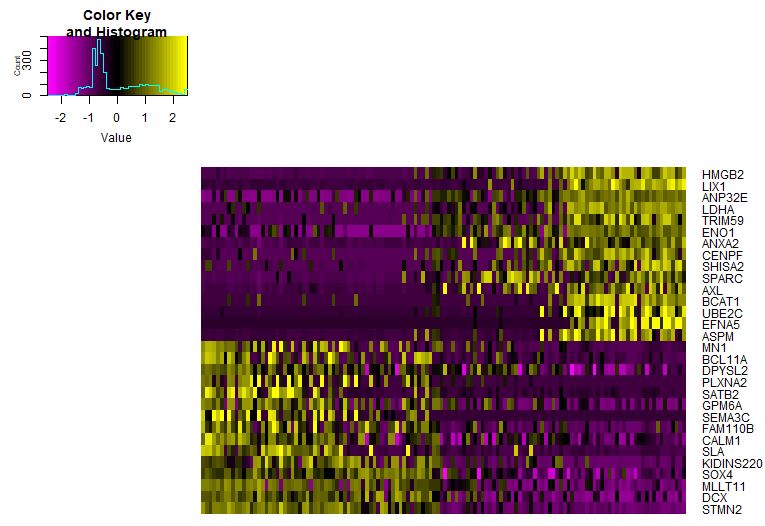
热图展示各个亚群的marker基因
1
2
3
4
5
6
7
| library(dplyr)
seu.markers%>%group_by(cluster)%>%top_n(2,avg_logFC)
top10<-seu.markers%>%group_by(cluster)%>%top_n(10,avg_logFC)
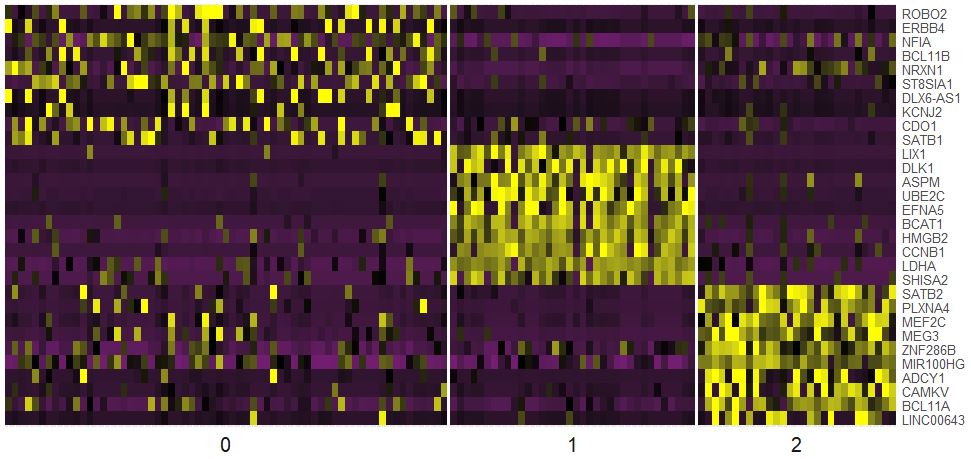
DoHeatmap(object = seu,genes.use = top10$gene,slim.col.label = TRUE,remove.key = TRUE)
|
