用常规转录组的知识对scRNA-seq数据进行初步探索
scRNA-seq数据分析学习(一)
| 用常规转录组的知识对scRNA-seq数据进行初步探索 |
bulk RNA-seq和scRNA-seq的区别
http://www.bio-info-trainee.com/2548.html
- 样本量,基因数量导致统计学环境的变化
通常情况下样本量都是成千上万的,检测的基因数量相对常规转录组较少
- 计算量迫使算法需要优化
成千上万甚至几十万的样本量对计算要求非常高
- 待解决的生物问题有所不同
- 不仅仅是不同状态的不同,一个样本就是一个因素
- 细胞、组织间的异质性问题
- 探究变化的过程追踪和重现
- 相对常规转录组而言,scRNA-seq分析流程软件工具的成熟度有待提高,目前还没有对整个分析流程的金标准
单细胞差异基因表达统计学方法
- 归一化
- 聚类分群
- 重要基因挑选
- 差异基因
- marker基因
- 变异基因
安装并加载scRNAseq这个R包
R包scRNAseq内含数据集,下载安装加载相应的辅助R包来探索scRNAseq的内置数据集,对单细胞转录组分析进行初步探索(在此之前已经下载好了所需的R包)
下载R包
1
2
3
4
5
6
7
8
9
10
11
12
13
14
15
|
options()$repos
options("repos"=c(CRAN="https://mirrors.tuna.tsinghua.edu.cn/CRAN/"))
options()$repos
options()$BioC_mirror
options(BioC_mirror="https://mirrors.ustc.edu.cn/bioc/")
options()$BioC_mirror
(!requireNamespace("Rtsne"))
install.packages("Rtsne")
(!requireNamespace("BiocManager"))
install.packages("BiocManager")
(!requireNamespace("scRNAseq"))
BiocManager::install("scRNAseq")
|
加载R包
1
2
3
4
5
6
7
8
9
10
11
|
library(Rtsne)
library(FactoMineR)
library(factoextra)
library(scater)
library(scRNAseq)
library(M3Drop)
library(ROCR)
library(tidyr)
library(cowplot)
library(ggplot2)
|
scRNA-seq包中的数据集
这个内置的是Pollen et al.2014年数据集,人类单细胞数据,分为4类:NPC、GW16、GW21、GW21+3。此R包只提供了4种细胞类型,完整的数据是23730 features,301 samples。
这里面的表达矩阵是有RSEM(Li and Dewey 2011)软件根据hg38 RefSeq transcription得到的,总共130个文库。每个细胞测了2次。测序深度不一样。
载入R包scRNA-seq
1
2
3
4
5
| library(scRNAseq)
data(fluidigm)
ct<-floor(assays(fluidigm)$rsem_counts)
ct[1:4,1:4]
dim(ct)
|

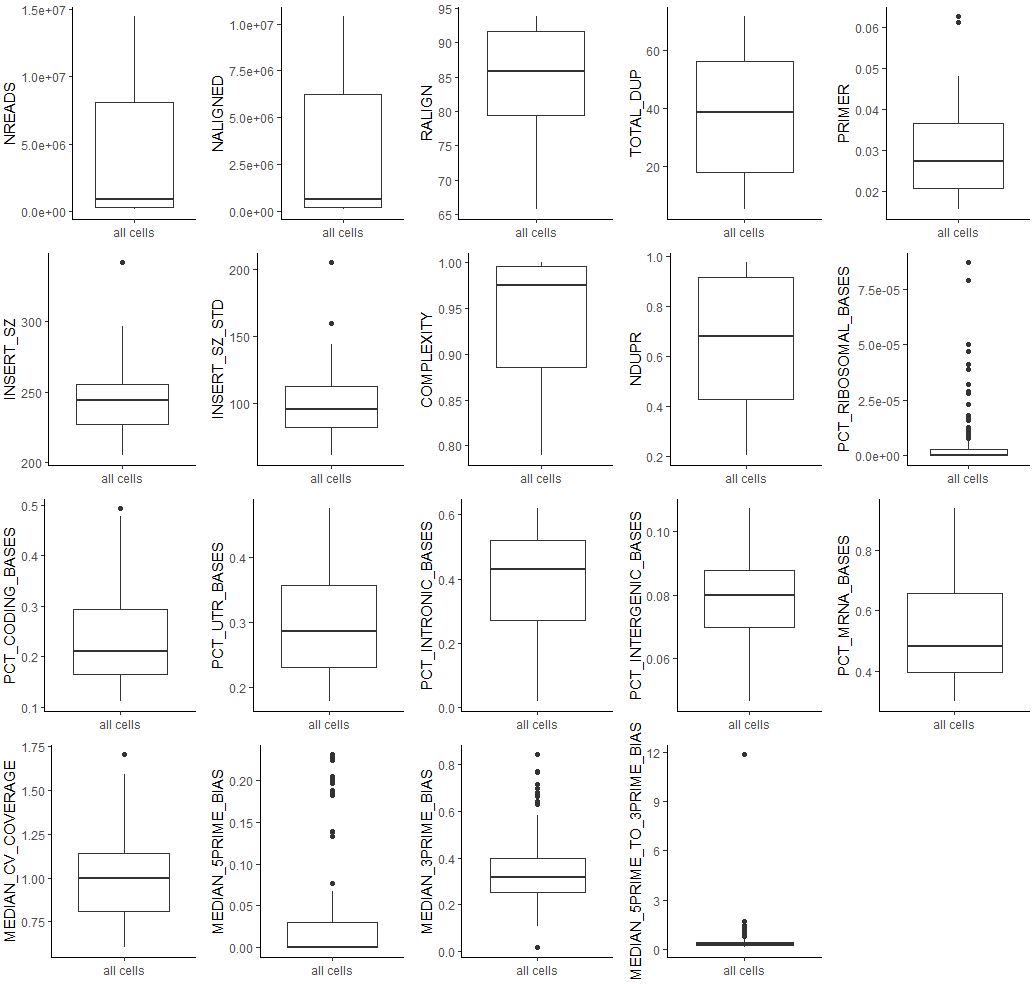
接下来的代码初步探索scRNA-seq内置数据集的各个属性
1
2
3
4
5
6
7
8
| sample_ann<-as.data.frame(colData(fluidigm))
box<-lapply(colnames(sample_ann[,1:19]), function(i){
dat<-sample_ann[,i,drop=F]
dat$sample=rownames(dat)
ggplot(dat,aes('all cells',get(i))) +geom_boxplot() +xlab(NULL) +ylab(i) +theme_classic()
})
plot_grid(plotlist = box,ncol = 5)
|
1
2
3
4
5
6
|
counts<-ct
table((apply(counts, 1, function(x) sum(x>0))))
table((apply(counts, 1, function(x) sum(x>0)>0)))
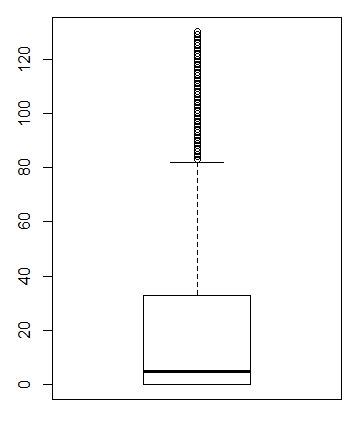
boxplot(apply(counts, 1, function(x) sum(x>0)))
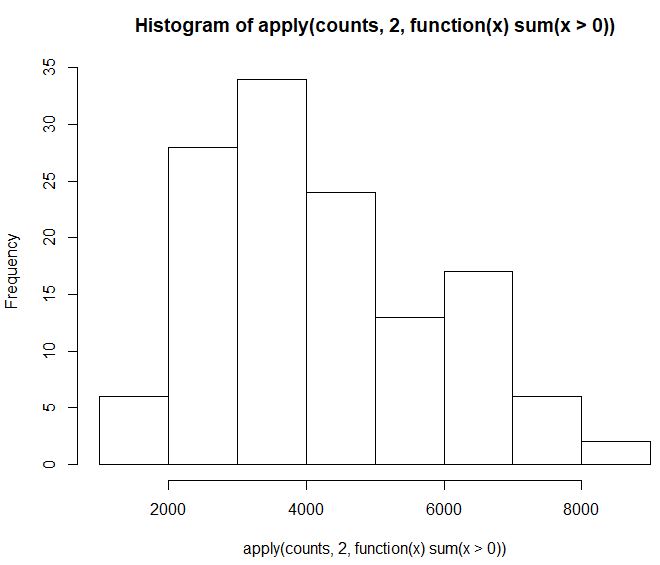
hist(apply(counts,2,function(x) sum(x>0)))
|

过滤(基因+细胞)
1
2
3
4
5
6
7
8
9
10
11
12
13
14
15
16
17
18
19
20
21
22
23
24
25
26
27
28
29
|
filter<-colnames(sample_ann[,c(1:9,11:16,18,19)])
tf<-lapply(filter,function(i){
dat<-sample_ann[,i]
dat<-abs(log10(dat))
fivenum(dat)
(up<-mean(dat)+2*sd(dat))
(down<-mean(dat)-2*sd(dat))
valid<-ifelse(dat>down & dat<up,1,0)
})
tf<-do.call(cbind,tf)
choosed_cell<-apply(tf, 1, function(x) all(x==1))
table(sample_ann$Biological_Condition)
sample_ann=sample_ann[choosed_cell,]
table(sample_ann$Biological_Condition)
ct<-ct[,choosed_cell]
dim(ct)
|

探索基因的表达情况
1
2
3
4
5
| ct[1:4,1:4]
counts<-ct
table(apply(counts, 1, function(x) sum(x>0)))
fivenum(apply(counts, 1, function(x) sum(x>0)))
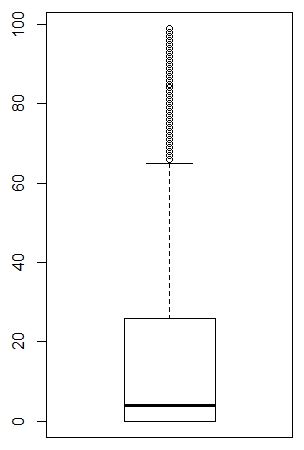
boxplot(apply(counts, 1, function(x) sum(x>0)))
|

1
2
3
|
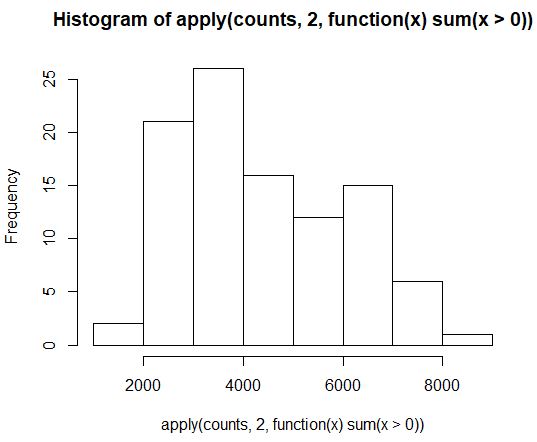
fivenum(apply(counts, 2, function(x) sum(x>0)))
hist(apply(counts, 2, function(x) sum(x>0)))
|

R语言中fivenum函数介绍:https://blog.csdn.net/mr_muli/article/details/79616124
R语言中do.call函数介绍:https://blog.csdn.net/zdx1996/article/details/87899029
R语言all函数介绍:https://blog.csdn.net/scong123/article/details/70184038
利用常规转录组分析知识查看细胞间所有基因表达量的相关性
1
2
3
4
5
6
|
dat<-log2(edgeR::cpm(counts)+1)
dat[1:4,1:4]
dat_back<-dat
exprSet<-dat_back
colnames(exprSet)
|


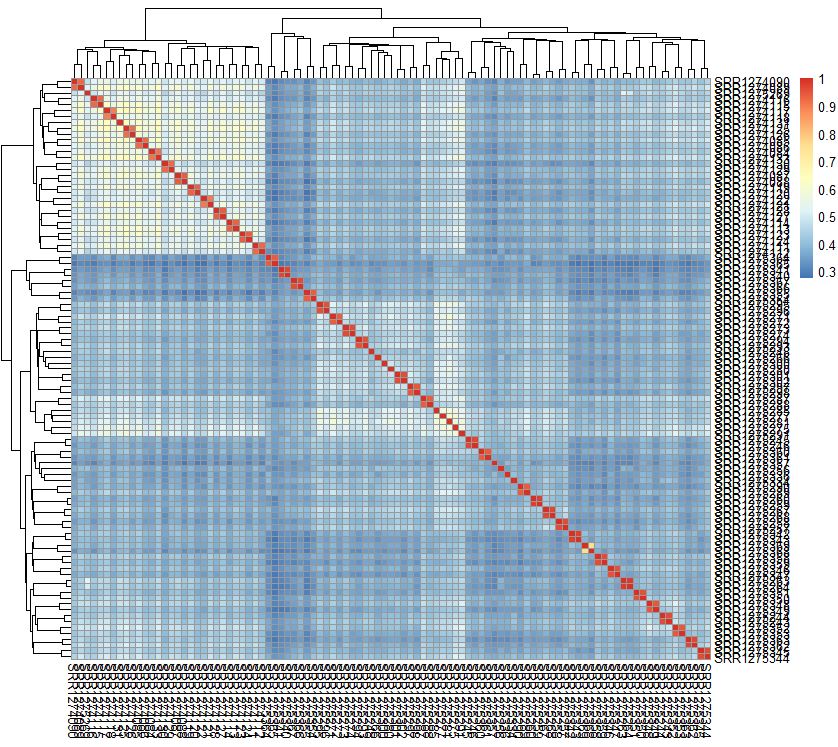
相关性可视化
1
| pheatmap::pheatmap(cor(exprSet))
|
1
2
3
4
5
|
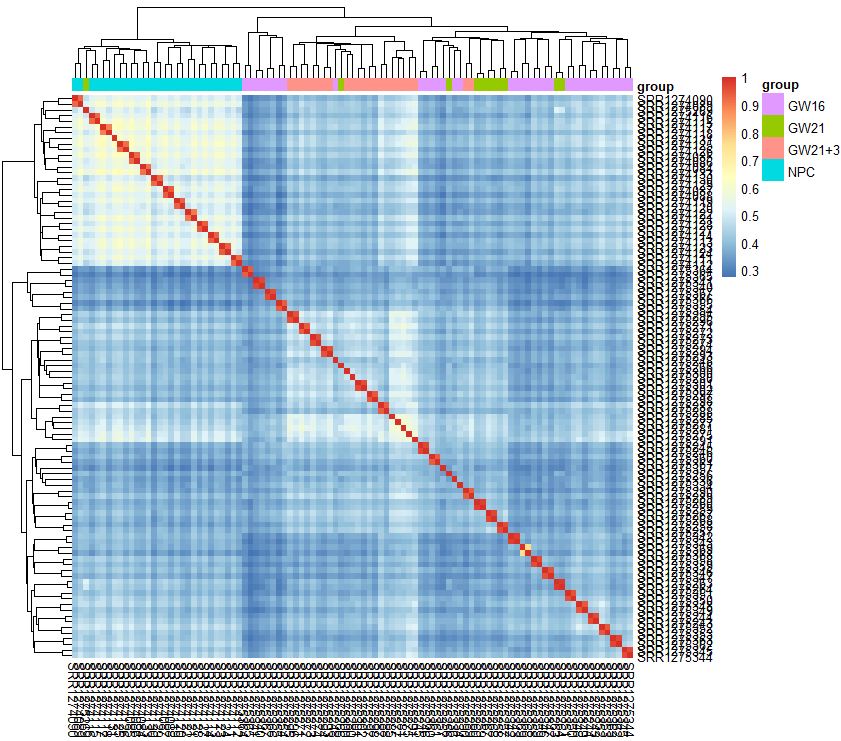
group_list<-sample_ann$Biological_Condition
tmp<-data.frame(group=group_list)
rownames(tmp)<-rownames(sample_ann)
pheatmap::pheatmap(cor(exprSet),annotation_col = tmp)
|
1
2
3
4
5
|
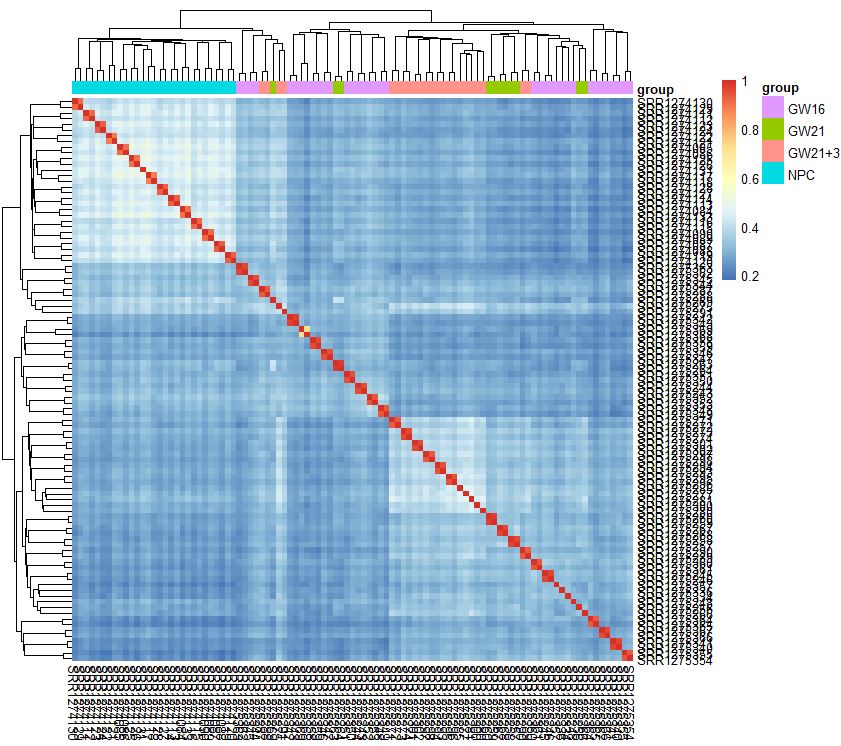
dim(exprSet)
exprSet=exprSet[apply(exprSet, 1, function(x) sum(x>1)>5),]
dim(exprSet)
pheatmap::pheatmap(cor(exprSet),annotation_col = tmp)
|

1
2
3
4
5
6
7
8
|
exprSet<-exprSet[names(sort(apply(exprSet, 1, mad),decreasing = T)[1:500]),]
dim(exprSet)
exprSet[1:4,1:4]
M<-cor(log2(exprSet+1))
tmp<-data.frame(group=group_list)
rownames(tmp)<-colnames(M)
pheatmap::pheatmap(M,annotation_col = tmp)
|

- 有热图分析可知,从细胞的相关性角度来看,NPC跟另外的GW细胞群可以区分得很好,但是GW本身得3个小群并没有那么好得区分度
- 简单的选取top的sd的基因来计算相关性,并没有明显的改善
首先对表达矩阵进行简单的层次聚类
1
2
| hc<-hclust(dist(t(dat)))
plot(hc,labels = FALSE)
|

1
2
3
4
| clus<-cutree(hc,4)
group_list<-as.factor(clus)
table(group_list)
table(group_list,sample_ann$Biological_Condition)
|
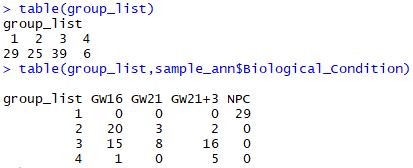
可以看到如果是普通的层次聚类的话,GW16、GW21、GW21+3是很难区分开的
看看常规PCA的结果
1
2
3
4
5
6
7
8
9
10
| dat<-dat_back
dat<-t(dat)
dat<-as.data.frame(dat)
anno<-sample_ann$Biological_Condition
dat<-cbind(dat,anno)
dat[1:4,26254:26256]
table(dat$anno)
dat.pca<-PCA(dat[,-ncol(dat)],graph = FALSE)
head(dat.pca$var$coord)
head(dat.pca$ind$coord)
|
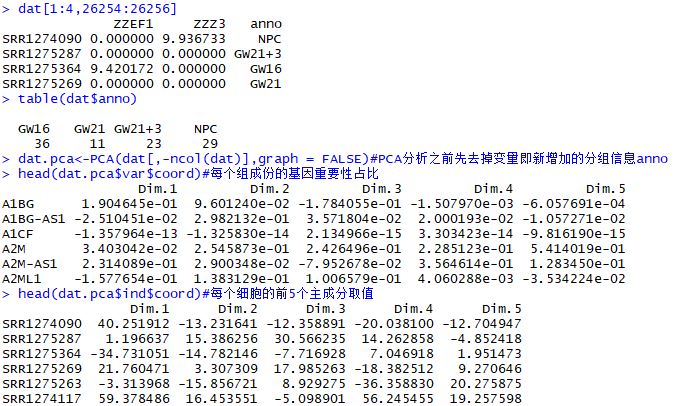
1
2
3
4
5
6
7
8
| fviz_pca_ind(
dat.pca,
geom.ind = "point",
col.ind = dat$anno,
addEllipses = TRUE,
legend.title="groups"
)
|
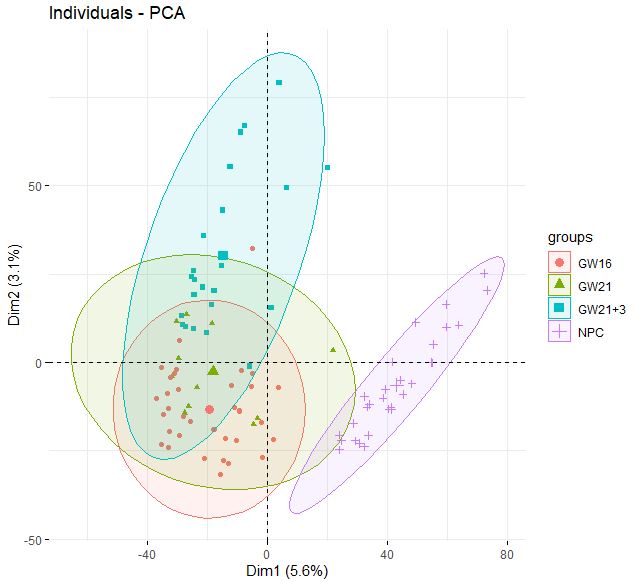
**同样的,NPC和其他类型细胞区分得很好,但GW本身得3个小群体并没有很好得区分度**
tSNE降维结果
1
2
3
4
5
6
7
8
|
dat_matrix<-dat.pca$ind$coord
library(Rtsne)
set.seed(42)
tsne_out<-Rtsne(dat_matrix,perplexity = 10,check_duplicates = FALSE)
plate<-sample_ann$Biological_Condition
plot(tsne_out$Y,col=rainbow(4)[as.numeric(as.factor(plate))])
|
参考资料
生信菜鸟团:http://www.bio-info-trainee.com/
生信技能树:http://www.biotrainee.com/
R包的下载方法:https://www.jianshu.com/p/8e0dece51757